This page explains how we work out the scores for the Nonathlon. Although it refers to some fairly complicated mathematics, you don't need to understand them to be able to understand the explanation!
My original idea for the Nonathlon was for a competition that would encourage people to:
1. have some fun!
2. attempt the full range of 'official' events in the Concept2 Online Ranking
After pondering this I came up with a third objective:
3. Let people of different ages, weights and genders compete on an 'even playing field'
The method I chose for this was to find out what the best time ever recorded on the online ranking was for every age, weight, gender and event combination. Using this information I could work out how well each person performed compared to the best people who were just like them (i.e. 31 year old heavyweight men, not 30-39 year old heavyweight men). From this I could give them a score, and people of different types could compare there scores directly.
In the first year of the competition I compared each person's score to the best of their current age and one year older. So a 31 year old heavyweight male would be compared in each event to the best performance by 31 and 32 year olds. This worked pretty well, and was very easy to explain, but had some drawbacks:
1. It was very data dependent. It takes a lot of time to put together the base data to work out the scores, and naturally in the process I can make mistakes. Given that each individual's score was tied to the data I found, even subtle mistakes (like missing off a tenth) could make a significant difference. In most cases mistakes were missing an improved time, or putting the time in the wrong place, both of which could make major differences.
2. It created 'performance wells' around people who did very well. So anyone who happened to be the same age as the world record holder for their age/gender would find themselves unable to compete, despite being a very good athlete. As an example, a 27 year old lightweight male has recorded a fantastic time for the marathon, so good in fact that other 27 year olds couldn't compete with the pace even over a 10k! So any 27 year old lightweight males were effectively barred from competition, because this time was so far away from what even very good rowers could achieve.
3. It was subject to relatively easy areas, most noteably in the lightweight female class, but affecting all classes to some extent, where few or no people had attempted a time. Anybody competing against this poor standard was likely to do well, even if they weren't really a good rower.
What I needed was some way of smoothing out the base data so that no one score made a big difference, but at the same time didn't smooth things out so much that the important variations were lost.
The method I chose works like this. If you draw two dots on a piece of paper you can draw a straight line between them. If you draw three dots you may not be able to draw a straight line through them, but generally you can draw a smoothly curving line through them. As the number of dots increases it becomes harder and harder to make the line smooth, without starting to 'skip' some of the dots. In effect you draw a line that is roughly what the dots represent. An example is this (old) graph of heavyweight men's 2k times by age:
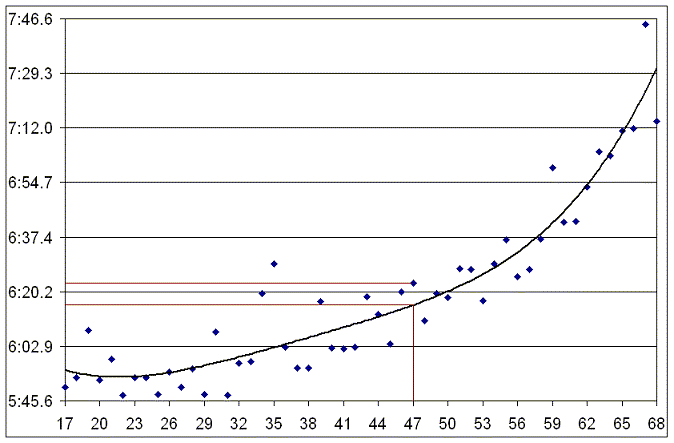
The line on the graph passes through few if any of the points on the graph, but it does a fair job of showing the overall shape of all the dots. If we pick an age (say 47) we can read off the target time for that age (around 6:15). You'll notice that this is a little faster than the best time recorded for that age (around 6:22), which is an effect of the smoothing. The curve is telling us that, based on all the 2k bests for heavyweight men, that record time is probably a little 'easy'.
The line shown is known as a polynomial curve, which means that there is a complicated formula (a polynomial equation) that can be used to represent the line. Polynomials equations can be described by their order, which is a measure of how complicated they are. The curve shown here is a 3rd order polynomial. The higher the order, the more closely the curve follows the dots. So in theory we would want to have a very high order polynomial to fit the dots closely, while still doing some smoothing. Unfortunately, for complex reasons I don't fully understand, as the order increases we can get some odd curves that would spoil the results. After some experimentation I settled on 3rd order polynomials as giving accurate but smoothed results without any wackiness!
Once we have the polynomial equation it's a pretty easy job to work out what the target time is for each age. We can then compare the two to get a Nonathlon score:
score = 1000 x target/actual
You can download the spreadsheet with all the scoring data on here
As always if you have questions you can contact me via